 About us
Alberding GNSS Status Software
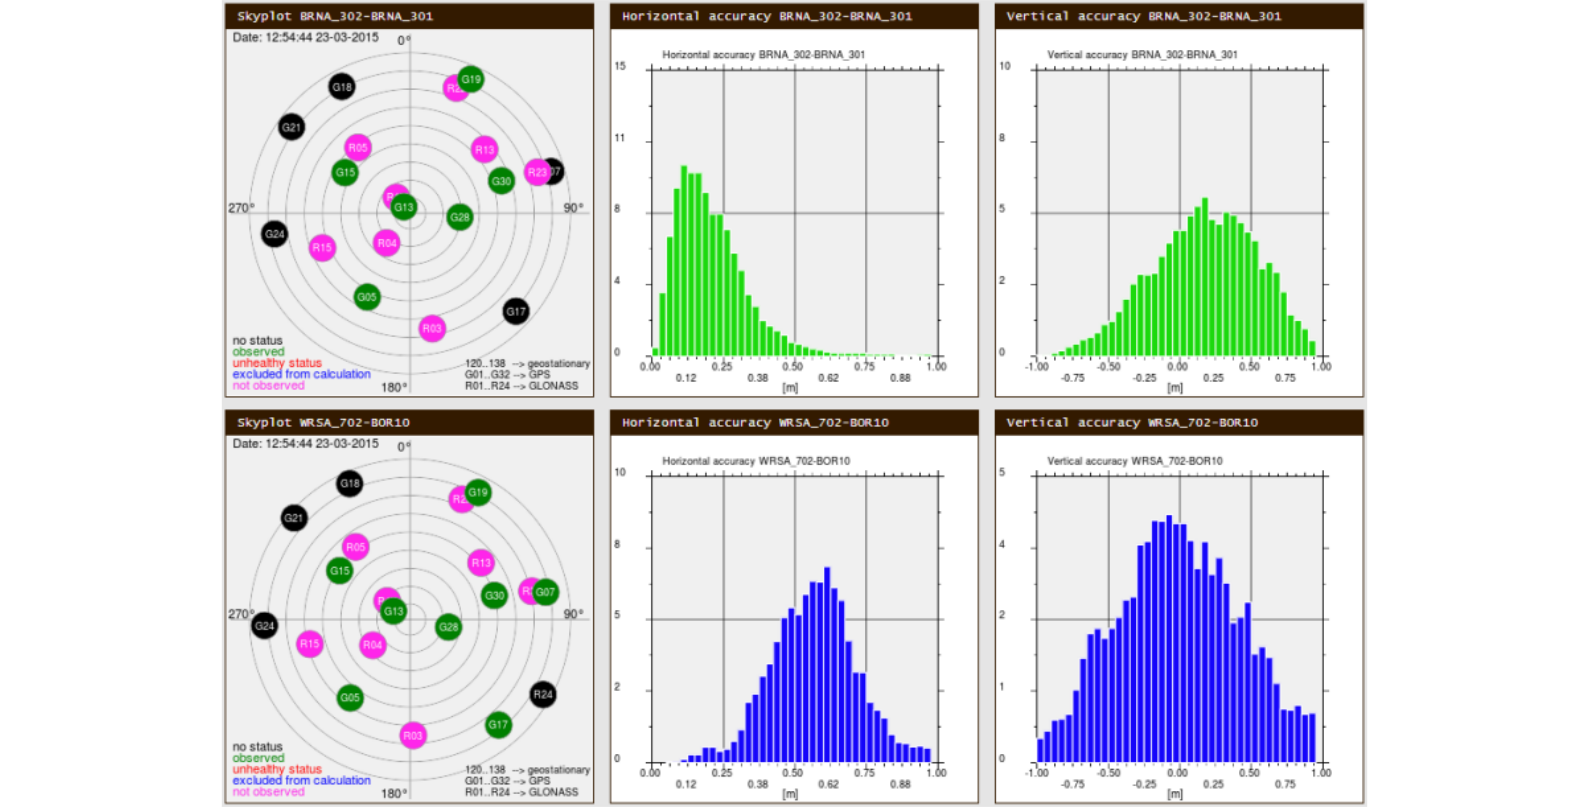
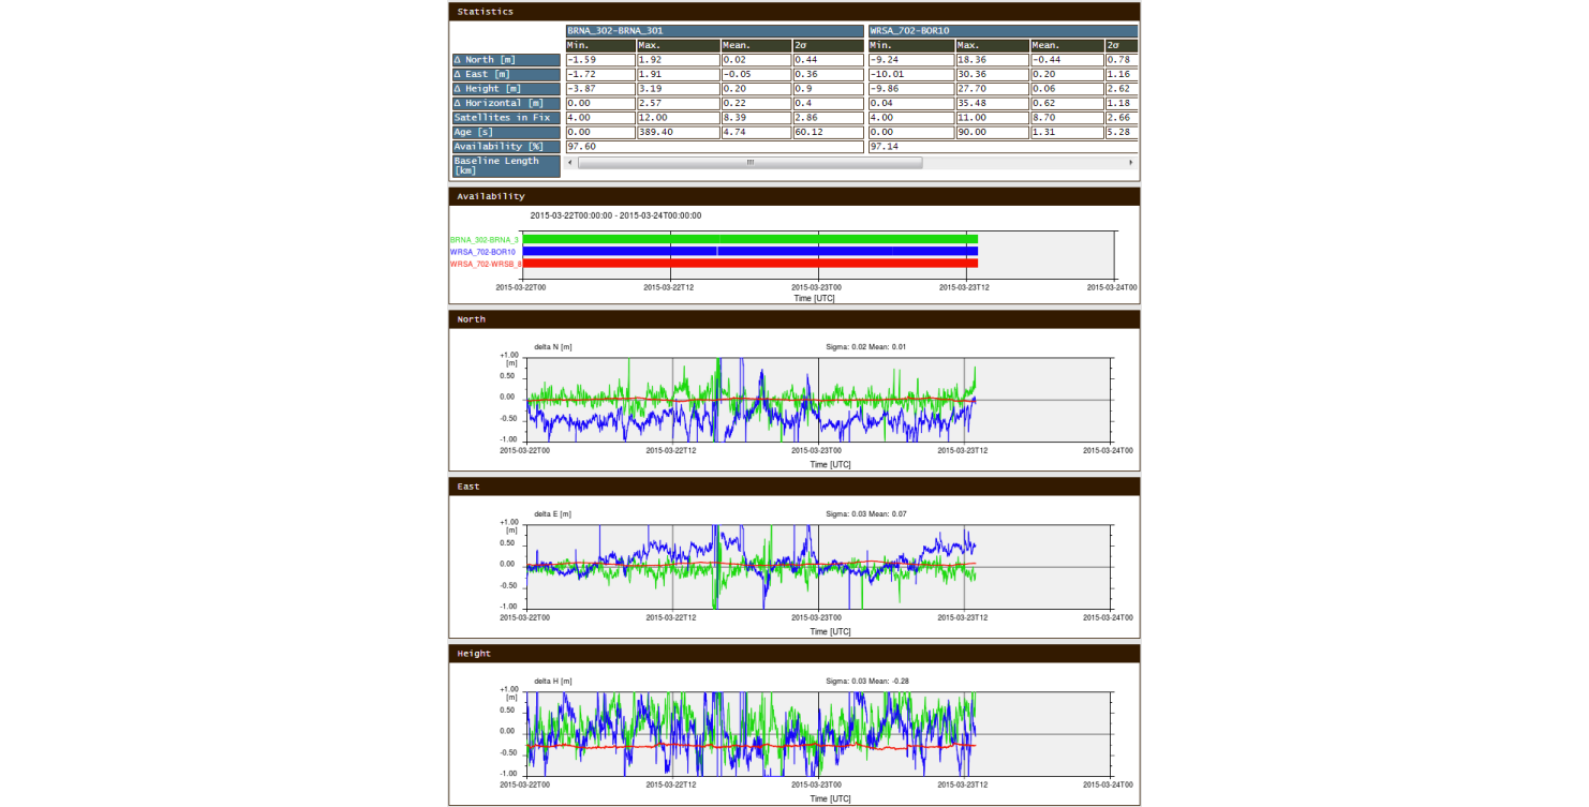
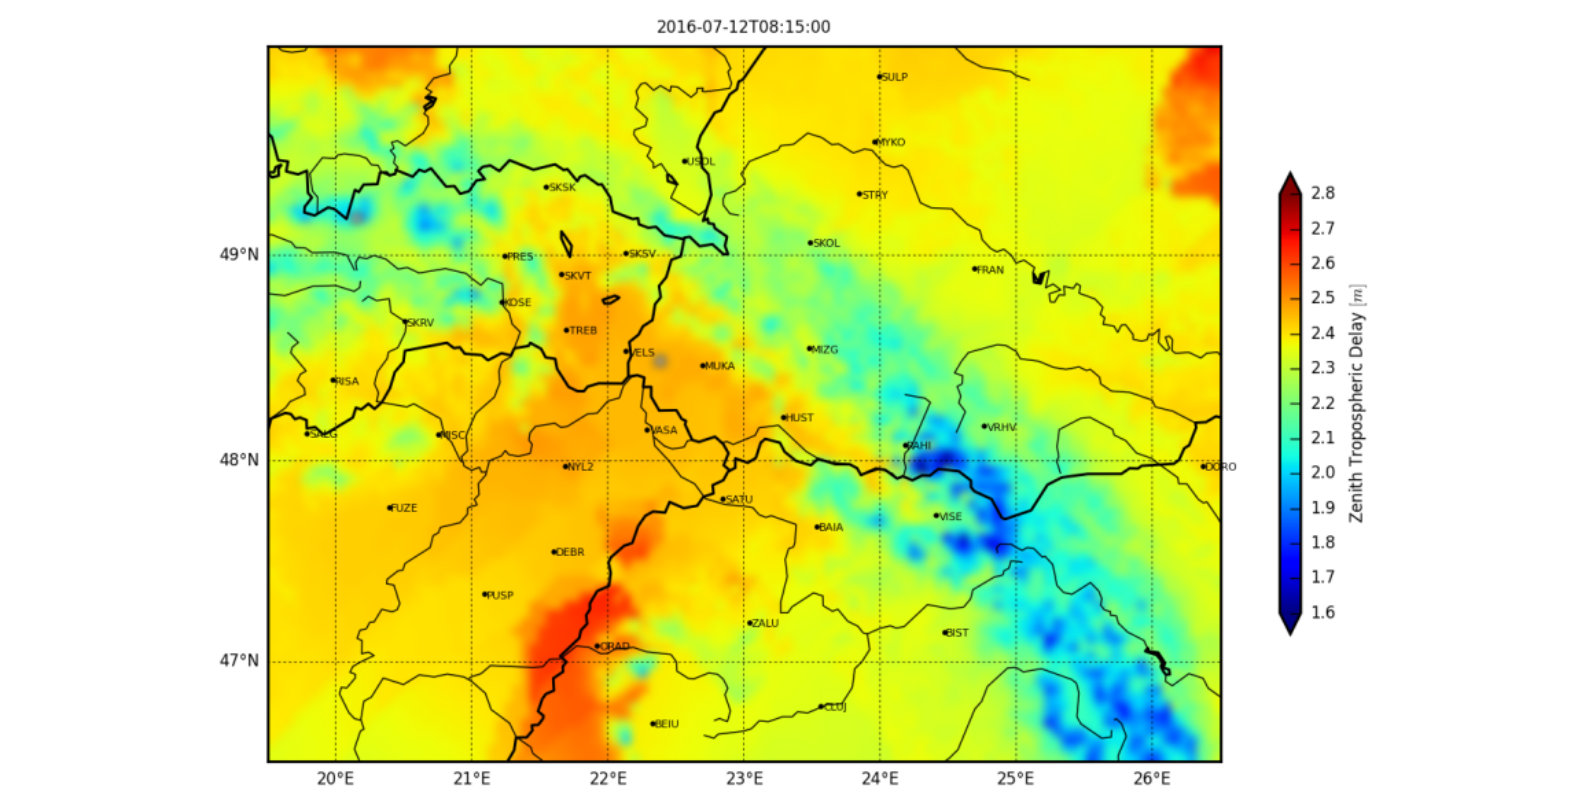
The complete system can be configured and monitored through a web interface in a convenient way. Processing results are visualised on colour-coded status tables, time series and scatter plots, bar graphs, histograms, skyplots, interactive maps and statistical tables. The web-based graphical user interface enables system operators to analyse data availability, positioning accuracy (N, E, H and 3D), data age and a lot more. The GNSS Status software can export scheduled and on-demand performance reports in PDF and CSV formats.
User configurable alarming functions guarantee that service operators and administrators will be automatically notified if data outages, system downtimes, performance degradations or other significant events are detected. The web interface uses visual alerts – a traffic light system. In addition, email and SMS warnings are released automatically should the monitored parameters exceed pre-defined threshold values. All system errors and events are recorded in an event log.
The data logging module archives measurement data and processing results at user defined intervals. System configuration changes are also logged in time-tagged configuration files so that it is easy to recover a working system after an accidental configuration mistake.
Some selected features:
|


